.
This page is best viewed with Mozilla Firefox. There could be issues with spacing on Internet Explorer ---

--
This forecast covers far southern Illinois, southeast Missouri, southwest Indiana, western Kentucky, and northwest Tennessee - for your local town/area - click here Remainder of tonight - Monday night: Isolated showers and thunderstorms - otherwise partly cloudy. Near normal temperatures. Lows: in the 66-69 degree range | Wind: Northeast winds at 5 mph. Normal lows for this time of the year are around 67 degrees.
-
-
Tuesday: Partly sunny. A slight chance for a shower or thunderstorm. Near normal temperatures.
Highs: in the 85-88 degree range. | Heat index: Values - low | Wind: East winds at 10 mph. Normal highs for this time of the year are around 88 degrees. .
Tuesday night: Partly cloudy. A slight chance for a shower or thunderstorm. Near normal temperatures.Lows: around 68 degrees | Wind: Easterly winds at 5 mph. Normal lows for this time of the year are around 67 degrees.
-
Wednesday: Partly cloudy. A slight chance for a shower or thunderstorm. Near normal temperatures.
Highs: around 87-89 degrees | Heat index: around 89-94 degrees | Wind: East winds at 10-15 mph. Normal highs for this time of the year are around 88 degrees.-
Wednesday night: Partly cloudy with scattered thunderstorms possible. Near normal to above normal temperatures.
Lows: around 67-70 degrees | Wind: Southeasterly winds at 10 mph. Normal lows for this time of the year are around 67 degrees.-
Thursday: Partly cloudy with a chance for a thunderstorms. Near normal temperatures.
Highs: around 85-89 degrees | Heat index: In the 88-91 degree range | Wind: Northerly winds at 10-15 mph - Normal highs for this time of the year are around 88 degrees. -
.
.

.

.
Forecast for your local town/city - Click Here
.
..
Join me on Facebook for more frequent updates on the weather in our local areaClick Here
.
---

The forecast for severe or extreme weather risk for the next 48 hours...
.
For the most up to date severe weather outlooks - click here.or
Visit the Storm Prediction Center's web-site - click here
Monday night: Severe weather is not anticipated. A few thunderstorms will be possible.
.
Tuesday: Severe weather is not anticipated. A few thunderstorms will be possible.
Tuesday: Severe weather is not anticipated. A few thunderstorms will be possible.
.
Tuesday night: Severe weather is not anticipated. A few thunderstorms will be possible.
.Wednesday: Severe weather is not anticipated. A few thunderstorms will be possible.
You can learn more about lightning safety by clicking here.
.
.
Here are the graphics for the coming days. Remember the orange area represents the slight risk (that is what the Storm Prediction Center calls it - not my favorite choice of wording) area for severe thunderstorms. The orange area means that severe thunderstorms will be possible but will most likely not produce widespread severe weather. The yellow area represents that areas where some thunderstorms will likely occur - but will remain, for the most part, below severe limits. A severe storm is one that produces winds of at least 58 mph and quarter size hail or larger. And/or tornadoes.
.
Tuesday's severe weather outlook graphic
.

.
Then here is the Wednesday's outlook (below). Right now an area of concern has not been outlined for Wednesday. I will need to post updated maps on Tuesday for the Wednesday time frame. Remember that these maps are updated several times a day - so check the main link here for the latest outlooks.
.
.

.
To view all watches and warnings in IL - Click Here
To view all watches and warnings in KY - Click Here
To view all watches and warnings in MO - Click Here
To view all watches and warnings in TN - Click Here
To view all watches and warnings in IL - Click Here
To view all watches and warnings in KY - Click Here
To view all watches and warnings in MO - Click Here
To view all watches and warnings in TN - Click Here
---
All other states- Click Here
.
.
.

HEADLINE: The weekend panned out just about as expected. Scattered storms on Sunday and Monday brought heavy downpours to many areas. Lot of lightning, as well. A few isolated reports of large hail and gusty winds were received on Sunday - mostly across the northern parts of southern Illinois and southeast Missouri.
.
The next several days will bring unsettled weather as a series of weak impulses move through the atmosphere. Any one of these impulses could trigger a round of showers and thunderstorms. Right now it appears the Wednesday/Thursday time frame might bring the best chances. Will monitor. .
Significant to major flooding will continue on portions of the Mississippi River and Missouri River basins. This will be a long summer of flooding for some areas. We are also concerned that the Ohio River will continue to back up. This could cause flooding over parts of southern IL and western KY. Stay tuned.
.
We have a TON of new weather maps on the Weather Observatory web-site - these include temperatures, wind speed, dew points, heat index, barometric pressure, predicted rainfall, climate forecast, medium and long range maps, forecasts and more! Click here .
.
.

.
-----------------------------
.

.
.
Significant to major flooding is likely to continue across the Missouri Valley in the coming weeks - latest river information - click here..
To follow the flood information along the Missouri River - click here for a special Facebook page that has been made for those concerned.
.
.
We are going to have to monitor the current pattern - these mesoscale thunderstorm complexes that keep moving through the region can produce heavy rainfall. This will cause rivers to rise even further. .
The Ohio River is starting to back up because of the high water levels on the Mississippi River. This is going to be a concern for quite some time to come (perhaps WELL into the summer months). Those living along rivers should monitor updated forecasts.
.
To view the interactive river map below - click here. The areas in purple and red are experiencing significant flooding issues.
.

.
.

.
Let's check out the how much rain is forecast to fall over the next 48 hours. Keep in mind that during the summer months heavy thunderstorms can produce excessive amounts of rain in a short period of time. This map is to give you a general broad brushed idea of what can be expected. Some areas during the summer months will pick up very little precipitation while neighboring areas receive quite a bit. Thus is the nature of thunderstorms and the summer pattern.
.
If you would like to view the 24, 48, 72, and 120 hour maps then click here.
.

.
.
I also now have thunderstorm probabilities available on the web-site - you can click hour by hour and see where the best chances for thunderstorms will exist. Here is the link - you can also choose your own region by clicking on a state.
ALSO NOW AVAILABLE - Six hour probability precipitation maps.
.
.

You can also now view the probability of X amount of rain (you pick the value on the web-site) in a six hour period of time. Those maps can be viewed here.
.
.

Remember you can now view all of the temperature graphics (that you see below) - and more - by clicking here
.
.
Below image - Low temperatures for Tuesday morning
.

Below image - High temperatures for Tuesday afternoon.
.

.
Below image - Low temperatures for Wednesday morning
.

.
Below image - High temperatures for Wednesday afternoon
.

.

Let's also take a look (the map below) at the expected heat index for tomorrow afternoon. You can view this map for other days by clicking here. Remember - the heat index is what the temperature feels like to your body when the temperature and humidity are combined. Heat index calculator can be viewed by clicking here.
.
Heat index values won't be a big issue on Tuesday.
.

.
This first map is for Tuesday and the second map is for Wednesday
.

Also the UV forecast for those interested - click here
Heat safety advice and information - click here
How much above or below normal will high temperatures be tomorrow?
.
The map below shows you the departure from normal highs (normal highs are around 82-85 degrees). This gives you a general idea of the type of weather pattern we are in. Warmer than normal or cooler than normal?
.
For example if the normal high is 80 degrees and the actual high is 90 degrees then we would be 10 degrees above normal. You can find this map on the web-site, as well - click here.
.
First map is for Tuesday and second map is for Wednesday
.

.


666666666666666666666666666666666666666666666666
These are the record highs and lows for June 30th-July 3rd, 2011. Quite a few record highs scattered around the central United States. The purple dots are record low temperatures and the red dots are record high temperatures. To view the most up to date maps - with details on each record high and low - click here.
.


.

.

..
.
.

We have a number of new radars available on our Weather Observatory web-site!
---
We now offer St Louis, Mt Vernon, Evansville, Poplar Bluff, Cape Girardeau, Marion, Paducah, Hopkinsville, and Dyersburg Interactive City Radars. We also have the two regional radars and now offer you three GR Earth radars.
http://www.weatherobservatory.com/weather-radar.htm---
---
--------------------
.

.
No tropical weather is forecast for the next couple of days. We will be watching a system in the Bahamas. It should move towards Florida or off the east coast of Florida. .
You can view satellite images of the tropics by clicking here - we have a variety of satellite images available on the Weather Observatory web-site.
Latest Official National Hurricane Center Tropical Outlook - click here.
--------------------
.

.
You can see from the maps (over the last weeks worth of posting) that a large chunk of real estate to our south and west is experiencing drought conditions. You can view these maps by clicking here, as well.
.
Here is the Palmer Drought Index - feast or famine - feast or famine. Either too wet or too dry. So it goes - or so it seems.
.

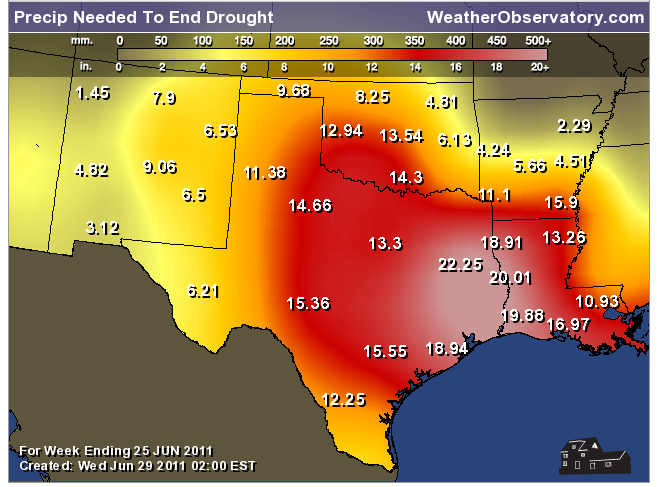
Here is a map that shows you how much rain is needed to end the drought over Texas - and other areas to our south and west.
.
.
Here is a map that shows you the current soil moisture. Quite wet in much of our region. Although areas in southern Missouri, northeast Arkansas, and western Tennessee could use some rain..

.
You can learn more about the current drought by visiting this Climate Prediction Center website - click here.
.
---

--
You can now view the 6-10 and 8-14 day forecast maps for temperature and precipitation! Maps are available by clicking here.
.
1. Unsettled pattern this week. Severe threat appears low. Main concern would be heavy downpours and lightning.2. No big concern in the long range - at this time.
.
3. We seem to be riding the boundary between below normal and above normal temperatures - however - for the most part it has been above normal. I guess the real question is will I need to throw the towel in - soon - on the thoughts that July and August would bring mostly below normal temperatures. Certainly hasn't shaped up that way just yet. .
.
Let's take a look at how my June forecast ended up - I forecasted above normal precipitation with near normal tp above normal temperatures - I forecasted a hot start to summer (June-August) but that July and August would end up below normal in the temp department with normal to above normal rainfall..
The summer did start out warm - with above normal temperatures. Precipitation was also above normal.
.
Click image for real size view - this first image is the temperature departures. The second image is the precipitation departures..


To view all watches and warnings in Illinois - Click Here
To view all watches and warnings in Kentucky - Click Here
To view all watches and warnings in Missouri - Click Here
To view all watches and warnings in Tennessee - Click Here
---
All other states- Click Here
http://www.weather.gov/organization.php
.
For the latest watches and warnings please visit your local National Weather Service Office web-sitehttp://www.weather.gov/organization.php
.

You can find me on Facebook under Beau Dodson Weather - hit LIKE at the top of the page and you can follow along - also please pass the link along to your friends.
.
Don't forget that our friends at the Paducah, Kentucky US National Weather Service Office now has a Facebook page, as well! Click here and then hit LIKE at the top of their page.
.
The McCracken County Office of Emergency Management now has a Facebook page? This is a great way to stay in touch with local officials during and before a natural disaster. Here is their page - hit LIKE at the top of the button.
.
You can also find me on Twitter under Beau Dodson.
---
Meteorologist Beau Dodson---
"We don't control the weather - we just predict it"
.
McCracken County Office of Emergency Management
--------------------

I send out emails 2-4 days in advance of widespread severe weather episodes. Basically this is a "heads up" email. If you would like to subscribe then click here.
.
---
This site is non-profit and brought to you as a public service! .

No comments:
Post a Comment