.
This page is best viewed with Mozilla Firefox. There could be issues with spacing on Internet Explorer ---

--
This forecast covers far southern Illinois, southeast Missouri, southwest Indiana, western Kentucky, and northwest Tennessee - for your local town/area - click here.
.
Here is my current personal forecast thoughts...
Remainder of tonight - Tuesday night: A few clouds. Isolated thunderstorm possible - mainly over the northern part of the region - Illinois/Indiana/northern Kentucky Mild. Well above normal temperatures. Lows: in the 73-76 degree range | Wind: Southwest winds at 5 mph. Normal lows for this time of the year are around 69 degrees.
.
Watches and warnings - click here
-
.
Watches and warnings - click here
-
Wednesday: Dangerous heat wave. Mostly sunny. Hot. Above normal temperatures.
Highs: in the 96-98 degree range. | Heat index: Values - 100-115 degrees | Wind: Southwest winds at 5 mph. Normal highs for this time of the year are around 89 degrees. Heat safety advice and information - click here
Lows: around 74-76 degrees | Wind: Southwest winds at 5 mph. Normal lows for this time of the year are around 69 degrees.
-
Thursday: Dangerous heat wave. A few clouds. Hot and humid. Above normal temperatures.
Highs: around 93-98 degrees | Heat index: around 105-117 degrees | Wind: South/southwest winds at 5-10 mph. Normal highs for this time of the year are around 89 degrees. Heat safety advice and information - click here
-
Thursday night: A few clouds. Very mild. Well above normal temperatures.
Lows: around 74-77 degrees | Wind: Southerly winds at 5 mph. Normal lows for this time of the year are around 69 degrees.-
Friday: Heat wave. Mostly sunny - hot and humid. Above normal temperatures.
Highs: around 94-98 degrees | Heat index: In the 102-110 degree range - locally higher | Wind: Southwesterly winds at 10 mph - Normal highs for this time of the year are around 89 degrees.Heat safety advice and information - click here
-
.
.

The heat continues and continues. June and July have both been amazingly above normal in both temperatures and rainfall. This pattern will continue into the near term. Any hope of below normal temperatures - at least for the time being - is off the table.
.
Heat safety advice and information - click here .
Tropical Storm Bret and Cindy have formed in the Atlantic - see the tropical discussion .

.
Forecast for your local town/city - Click Here
.
..
Join me on Facebook for more frequent updates on the weather in our local areaClick Here
.
---

The forecast for severe or extreme weather risk for the next 48 hours...
.
For the most up to date severe weather outlooks - click here.or
Visit the Storm Prediction Center's web-site - click here
Tuesday night: A few isolated severe storms are possible - esp over Illinois, Indiana, and Kentucky.
.
Wednesday: Severe weather is not anticipated. Dangerous heat levels.
Wednesday: Severe weather is not anticipated. Dangerous heat levels.
Wednesday night: Severe weather is not anticipated.
.Thursday: Severe weather is not anticipated. Dangerous heat levels.
.
Thursday night: Severe weather is not anticipated.
.Friday: Severe weather is not anticipated. Dangerous heat levels.
You can learn more about lightning safety by clicking here.
Here are the graphics for the coming days. Remember the orange area represents the slight risk (that is what the Storm Prediction Center calls it - not my favorite choice of wording) area for severe thunderstorms. The orange area means that severe thunderstorms will be possible but will most likely not produce widespread severe weather. The yellow area represents that areas where some thunderstorms will likely occur - but will remain, for the most part, below severe limits. A severe storm is one that produces winds of at least 58 mph and quarter size hail or larger. And/or tornadoes.
.
Wednesday Outlook
.

To view all watches and warnings in IL - Click Here
To view all watches and warnings in KY - Click Here
To view all watches and warnings in MO - Click Here
To view all watches and warnings in TN - Click Here
---
All other states- Click Here
.
The map you see below can be viewed by clicking on the watch and warnings map links above. The maps are interactive and you can move around the United States by simply clicking on the national map - or from the pull down menu where it says regions and US States - again this map is a sample map. To view the actual interactive map - click here.
.

.
.

HEADLINE: We just can't seem to shake the heat. No change in the near term - heat will continue. There are a variety of heat advisories in effect. Please see the above maps for the most up to date watches and warnings. Bottom line - use common sense if working outdoors. Also remember that leaving children, elderly people, and pets in a car can be extremely dangerous/deadly.
We have a TON of new weather maps on the Weather Observatory web-site - these include temperatures, wind speed, dew points, heat index, barometric pressure, predicted rainfall, climate forecast, medium and long range maps, forecasts and more! Click here
.
.
.

.
-----------------------------
.

.
.
Significant to major flooding is likely to continue across the Missouri Valley in the coming weeks - latest river information - click here..
To follow the flood information along the Missouri River - click here for a special Facebook page that has been made for those concerned.
.
You can read more about the summer flood threat by clicking HERE
.
To view the interactive river map below - click here. The areas in purple and red are experiencing significant flooding issues.
.

.
River Forecast Stages - Click Here
.
.

.
Let's check out the how much rain is forecast to fall over the next 72 hours. Keep in mind that during the summer months heavy thunderstorms can produce excessive amounts of rain in a short period of time. This map is to give you a general broad brushed idea of what can be expected. Some areas during the summer months will pick up very little precipitation while neighboring areas receive quite a bit. Thus is the nature of thunderstorms and the summer pattern.
.
If you would like to view the 24, 48, 72, and 120 hour maps then click here.
.

.
I have thunderstorm probabilities available on the web-site - you can click hour by hour and see where the best chances for thunderstorms will exist. Here is the link - you can also choose your own region by clicking on a state.
ALSO NOW AVAILABLE - Six hour probability precipitation maps.
.
.

You can also now view the probability of X amount of rain (you pick the value on the web-site) in a six hour period of time. Those maps can be viewed here.
.
.
.

Remember you can now view all of the temperature graphics (that you see below) - and more - by clicking here
.
.
Below image - Low temperatures for Wednesday morning
.

Below image - High temperatures for Wednesday afternoon.
.

.
Below image - Low temperatures for Thursday morning
.

.
Below image - High temperatures for Thursday afternoon
.

Below image - High temperatures for Friday morning
.

Below image - High temperatures for Friday afternoon
.

.
.
.

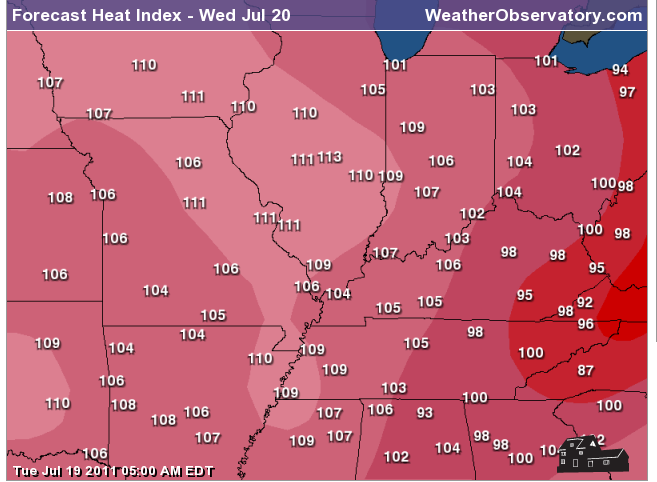
Let's also take a look (the map below) at the expected heat index for tomorrow afternoon. You can view this map for other days by clicking here. Remember - the heat index is what the temperature feels like to your body when the temperature and humidity are combined. Heat index calculator can be viewed by clicking here.
.
Wednesday - Thursday - Friday images. HOT (potentially dangerous and already proven deadly this summer) will be the norm in the coming days. Remember these are heat index values - what the temperature will feel like to your skin.
.


Also the UV forecast for those interested - click here
Heat safety advice and information - click here
How much above or below normal will high temperatures be tomorrow?
.
The map below shows you the departure from normal highs (normal highs are around 82-85 degrees). This gives you a general idea of the type of weather pattern we are in. Warmer than normal or cooler than normal?
.
For example if the normal high is 80 degrees and the actual high is 90 degrees then we would be 10 degrees above normal. You can find this map on the web-site, as well - click here.
.
First map is for Wednesday and then the Thursday and Friday maps - WELL above normal temperatures will be the rule in the coming days. We just can't shake this pattern.
.


66666666666666666666666666666666666666666666666
These are the record highs and lows for July 16th through July 18th, 2011. A smattering of records - but nothing unusual. It is summer! The purple dots are record low temperatures and the red dots are record high temperatures. To view the most up to date maps - with details on each record high and low - click here.
.


We have a number of new radars available on our Weather Observatory web-site!
---
We now offer St Louis, Mt Vernon, Evansville, Poplar Bluff, Cape Girardeau, Marion, Paducah, Hopkinsville, and Dyersburg Interactive City Radars. We also have the two regional radars and now offer you three GR Earth radars.
http://www.weatherobservatory.com/weather-radar.htm---
---
--------------------
.

A tropical system is off the southeast coast of the United States - this system is not forecast to impact the United States - outside of some wave action/rip currents.
.
You can view satellite images of the tropics by clicking here - we have a variety of satellite images available on the Weather Observatory web-site.
.

Latest Official National Hurricane Center Tropical Outlook - click here.
--------------------
.

.
You can see from the maps (over the last weeks worth of posting) that a large chunk of real estate to our south and west is experiencing drought conditions. You can view these maps by clicking here, as well.
.
Here is the soil moisture anomaly map - you can see that the drought is attempting to creep into our region. This will need to be monitored in the coming weeks. .

.
You can learn more about the current drought by visiting this Climate Prediction Center website - click here..
---

--
You can now view the 6-10 and 8-14 day forecast maps for temperature and precipitation! Maps are available by clicking here.
.
.
You can see from these maps that above normal temperatures are forecast to continue for the medium range and long range. This is becoming a broken record - and NOT how I thought July would turn out. Win some and lose some! Definitely a loss on the July temperature forecast.
.
The orange and red areas on the map indicate where temperatures are expected to be above normal - this is a probability chart - the deeper the orange and red the better chance for above normal temperatures. .


.
1. Heat will continue. There are some hints on/off on the long range data that perhaps there will be some break in the heat next week - but I am not confident enough to forecast that - at least at this point. I will continue to monitor and update. For now the heat will continue - at times there will be dangerous heat index readings.

To view all watches and warnings in Illinois - Click Here
To view all watches and warnings in Kentucky - Click Here
To view all watches and warnings in Missouri - Click Here
To view all watches and warnings in Tennessee - Click Here
---
All other states- Click Here
http://www.weather.gov/organization.php
.
For the latest watches and warnings please visit your local National Weather Service Office web-sitehttp://www.weather.gov/organization.php
.

You can find me on Facebook under Beau Dodson Weather - hit LIKE at the top of the page and you can follow along - also please pass the link along to your friends.
.
Don't forget that our friends at the Paducah, Kentucky US National Weather Service Office now has a Facebook page, as well! Click here and then hit LIKE at the top of their page.
.
The McCracken County Office of Emergency Management now has a Facebook page? This is a great way to stay in touch with local officials during and before a natural disaster. Here is their page - hit LIKE at the top of the button.
.
You can also find me on Twitter under Beau Dodson.
---
Meteorologist Beau Dodson---
"We don't control the weather - we just predict it"
.
McCracken County Office of Emergency Management
--------------------

I send out emails 2-4 days in advance of widespread severe weather episodes. Basically this is a "heads up" email. If you would like to subscribe then click here.
.
---
This site is non-profit and brought to you as a public service! .

No comments:
Post a Comment