.
This page is best viewed with Mozilla Firefox. There could be issues with spacing on Internet Explorer ---

--
This forecast covers far southern Illinois, southeast Missouri, southwest Indiana, western Kentucky, and northwest Tennessee - for your local town/area - click here.
.
Here are my current personal forecast thoughts...
Remainder of tonight - Monday night: Clear and warm. Above normal temperatures. Lows: in the 68-73 degree range | Wind: Southerly winds at 5 mph. Normal lows for this time of the year are around 69 degrees. Precipitation probability - 0%
.
-
.
-
Tuesday: Sunny and hot. Humid. Above normal temperatures.
Highs: in the 97-102 degree range. | Heat index: Values - 105-110 degrees | Wind: South winds at 10-15 mph. Normal highs for this time of the year are around 89 degrees. Precipitation probability - 0% Heat safety advice and information - click here
Tuesday night: A few clouds. Warm. Above normal temperatures.
Lows: around 73-76 degrees | Wind: South winds at 5-10 mph. Normal lows for this time of the year are around 69 degrees. Precipitation probability - 0%
-
Wednesday: A few clouds. Hot. A few thunderstorms will be possible. Above normal temperatures.
Highs: around 97-100 degrees | Heat index: around 100-110 degrees | Wind: Winds becoming northerly at 5-10 mph. Normal highs for this time of the year are around 89 degrees. Precipitation probability - 30%Heat safety advice and information - click here
.
Wednesday night: Partly cloudy and mild. A few thunderstorms possible. Above normal temperatures.
Lows: around 74 degrees | Wind: Northeast winds at 5 mph. Normal lows for this time of the year are around 69 degrees. Precipitation probability - 30%-
Thursday: Partly cloudy. Thunderstorms possible - some could be severe. Warm. Above normal temperatures.
Highs: around 88-93 degrees | Heat index: In the 97 degree range | Wind: Variable winds at 5-10 mph - Normal highs for this time of the year are around 89 degrees. Precipitation probability - 60%Heat safety advice and information - click here
.
Thursday night: Partly cloudy and mild. A thunderstorm possible. Above normal temperatures.
Lows: around 75 degrees | Wind: Variable winds at 5 mph. Normal lows for this time of the year are around 69 degrees. Precipitation probability - 20%.
Friday: A few thunderstorms possible. Warm and humid. Above normal temperatures.
Highs: around 94 degrees | Heat index: In the 98 degree range | Wind: Southerly winds at 5-10 mph - Normal highs for this time of the year are around 89 degrees. Precipitation probability - 40%-
.
.

Another warm week. Tweaked temperatures a bit. Otherwise there were no major changes in the forecast.
.
Heat safety advice and information - click here .

.
Forecast for your local town/city - Click Here
.
..
Join me on Facebook for more frequent updates on the weather in our local areaClick Here
.
---

The forecast for severe or extreme weather risk for the next 48 hours...
.
For the most up to date severe weather outlooks - click here.or
Visit the Storm Prediction Center's web-site - click here
Monday night: Severe weather is not anticipated.
.
Tuesday: Severe weather is not anticipated.
Tuesday: Severe weather is not anticipated.
.
Tuesday night: Severe weather is not anticipated.
.Wednesday: A few scattered thunderstorms. Thunderstorms that do occur this time of the year can produce cloud to ground lightning, heavy rain in short periods of time, and gusty winds.
.
Wednesday night: A few scattered thunderstorms. Thunderstorms that do occur this time of the year can produce cloud to ground lightning, heavy rain in short periods of time, and gusty winds.
.Thursday: A few thunderstorms. Thunderstorms that do occur this time of the year can produce cloud to ground lightning, heavy rain in short periods of time, and gusty winds.
.
Thursday night: Severe weather is not anticipated.
.
Friday: A few scattered thunderstorms. Thunderstorms that do occur this time of the year can produce cloud to ground lightning, heavy rain in short periods of time, and gusty winds.
.
Here are the graphics for the coming days. Remember the orange area represents the slight risk (that is what the Storm Prediction Center calls it - not my favorite choice of wording) area for severe thunderstorms. The orange area means that severe thunderstorms will be possible but will most likely not produce widespread severe weather. The yellow area represents that areas where some thunderstorms will likely occur - but will remain, for the most part, below severe limits. A severe storm is one that produces winds of at least 58 mph and quarter size hail or larger. And/or tornadoes.
You can learn more about lightning safety by clicking here.
Here are the graphics for the coming days. Remember the orange area represents the slight risk (that is what the Storm Prediction Center calls it - not my favorite choice of wording) area for severe thunderstorms. The orange area means that severe thunderstorms will be possible but will most likely not produce widespread severe weather. The yellow area represents that areas where some thunderstorms will likely occur - but will remain, for the most part, below severe limits. A severe storm is one that produces winds of at least 58 mph and quarter size hail or larger. And/or tornadoes.
.
No organized severe weather in our region is currently forecast - so I didn't post the maps. You can view the most up to date graphics, though, by clicking here.
.
To view all watches and warnings in IL - Click Here
To view all watches and warnings in KY - Click Here
To view all watches and warnings in MO - Click Here
To view all watches and warnings in TN - Click Here
---
All other states- Click Here
.
The map you see below can be viewed by clicking on the watch and warnings map links above. The maps are interactive and you can move around the United States by simply clicking on the national map - or from the pull down menu where it says regions and US States - again this map is a sample map. To view the actual interactive map - click here.
.
.

HEADLINE: The summer that just won't quit - keeps on giving. More warm temperatures in the forecast. The good news is that there are some hints that the pattern may break down later this week into next week. If true then perhaps we can squeeze out several days with normal to below normal temperatures. I will believe it when I see it. The pattern over the last few months has produced above normal temperatures more often than not. As a matter of fact the Paducah, Kentucky National Weather Service Office has recorded above normal temperatures (averages for the whole month) for the past six months.
.
There will be a chance for thunderstorms later this week. Storm chances will arrive on Wednesday and continue into at least Friday. Friday may bring a more organized thunderstorm threat. We will have to monitor. Parts of our region could use the rain. See the drought map below..
We will be watching a potential tropical system moving through the Caribbean. This system could impact parts of Florida in the coming week. Still a bit too far out to know for sure. .
We have a TON of new weather maps on the Weather Observatory web-site - these include temperatures, wind speed, dew points, heat index, barometric pressure, predicted rainfall, climate forecast, medium and long range maps, forecasts and more! Click here
.
.
.

.
Heat safety advice and information - click here
.
-----------------------------
.

.
.
Significant to major flooding is likely to continue across the Missouri Valley in the coming weeks - latest river information - click here..
To follow the flood information along the Missouri River - click here for a special Facebook page that has been made for those concerned.
.
You can read more about the summer flood threat by clicking HERE
.
To view our interactive river map - click here. The areas in purple and red are experiencing significant flooding issues.
.

.
River Forecast Stages - Click Here
.
.

.
Let's check out the how much rain is forecast to fall over the next 72 hours. Keep in mind that during the summer months heavy thunderstorms can produce excessive amounts of rain in a short period of time. This map is to give you a general broad brushed idea of what can be expected. Some areas during the summer months will pick up very little precipitation while neighboring areas receive quite a bit. Thus is the nature of thunderstorms and the summer pattern.
.
If you would like to view the 24, 48, 72, and 120 hour maps then click here.
.

.
I have added thunderstorm probabilities to the web-site - you can click hour by hour and see where the best chances for thunderstorms will exist. Here is the link - you can also choose your own region by clicking on a state.
ALSO NOW AVAILABLE - Six hour probability precipitation maps.
.
.

You can also now view the probability of X amount of rain (you pick the value on the web-site) in a six hour period of time. Those maps can be viewed here.
.
.
.

Remember you can now view all of the temperature graphics (that you see below) - and more - by clicking here
.
.
Below image - Low temperatures for Tuesday morning
.

Below image - High temperatures for Tuesday afternoon.
.

.
Below image - Low temperatures for Wednesday morning.
.

.

Below image - Low temperatures for Thursday morning
.


.
.

Let's also take a look (the map below) at the expected heat index for tomorrow afternoon. You can view this map for other days by clicking here. Remember - the heat index is what the temperature feels like to your body when the temperature and humidity are combined. Heat index calculator can be viewed by clicking here.
.
The first map is for Tuesday and then Wednesday-Thursday
.


.
Also the UV forecast for those interested - click here
.
Heat safety advice and information - click here
How much above or below normal will high temperatures be tomorrow?
.
The map below shows you the departure from normal highs (normal highs are around 82-85 degrees). This gives you a general idea of the type of weather pattern we are in. Warmer than normal or cooler than normal?
.
For example if the normal high is 80 degrees and the actual high is 90 degrees then we would be 10 degrees above normal. You can find this map on the web-site, as well - click here.
.
First map is for Tuesday and then the Wednesday-Thursday maps. So much for any chance of below normal temperatures. I am quite disappointed in my summer outlook for temperatures. Long range forecasting is always a gamble.
.


66666666666666666666666666666666666666666666666
These are the record highs and lows for July 28th through July 31st, 2011. More record high temperatures than low temperatures. It has been a warm summer for many locations. The purple dots are record low temperatures and the red dots are record high temperatures. To view the most up to date maps - with details on each record high and low - click here.
.


We have a number of new radars available on our Weather Observatory web-site!
---
We now offer St Louis, Mt Vernon, Evansville, Poplar Bluff, Cape Girardeau, Marion, Paducah, Hopkinsville, and Dyersburg Interactive City Radars. We also have the two regional radars and now offer you three GR Earth radars.
http://www.weatherobservatory.com/weather-radar.htm---
---
--------------------
.

We are watching a new tropical system moving through the Caribbean. This system could impact parts of Florida and the southeast United States over the coming week. Interests in the Caribbean should pay attention to future forecast tracks.
.
To track Emily click here for our new tropical graphics
.
You can view satellite images of the tropics by clicking here - we have a variety of satellite images available on the Weather Observatory web-site.
.

.

.

.
Latest Official National Hurricane Center Tropical Outlook - click here.
.
One forecast model develops the system into a hurricane. The GFS takes this hurricane towards Florida - this coming Saturday. Again - still several days away and the forecast can and will likely need to be adjusted. This image is from www.wright-weather.com.

--------------------
.

.
You can see from the maps (over the last weeks worth of posting) that a large chunk of real estate to our south and west is experiencing drought conditions. You can view these maps by clicking here, as well.
.
Here is the Soil Moisture Anomalies map. The drought is starting to expand. This has been a concern all summer. Portions of our region have experienced heavy rainfall over the last 2 weeks. Although not everyone picked up rainfall. Those areas that missed the storms are dry. Hopefully the coming week will bring a few more rain chances. It does appear that will be the case. .

You can learn more about the current drought by visiting this Climate Prediction Center website - click here.
.
---

--
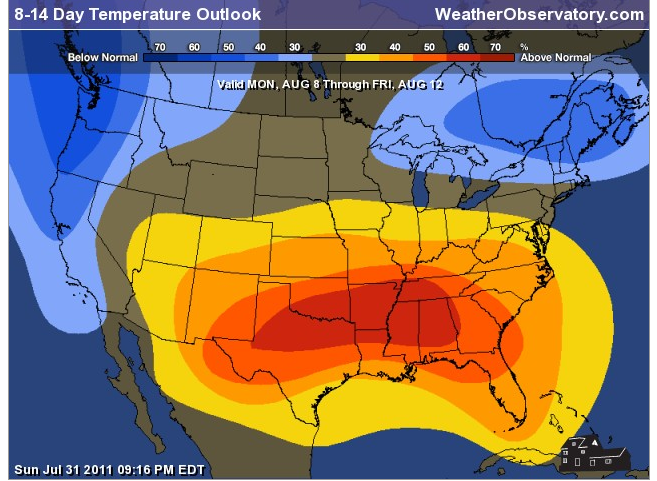
You can now view the 6-10 day and 8-14 day forecast maps for temperature and precipitation! Maps are available by clicking here.
.
.
You can see from these maps that above normal temperatures are forecast to continue for the medium range and long range. Seems like a broken record.
.
The orange and red areas on the map indicate where temperatures are expected to be above normal - this is a probability chart - the deeper the orange and red the better chance for above normal temperatures..
The second map is the precipitation outlook. Some good news in the mix - odds favor above normal precipitation during the 8-14 day outlook..
.

1. Long range indicates more hot weather next week. We will be fairly close to the NW flow boundary - this means that there will at least be a few chances for showers and thunderstorms over the coming 1-2 week period.

To view all watches and warnings in Illinois - Click Here
To view all watches and warnings in Kentucky - Click Here
To view all watches and warnings in Missouri - Click Here
To view all watches and warnings in Tennessee - Click Here
---
All other states- Click Here
http://www.weather.gov/organization.php
.
For the latest watches and warnings please visit your local National Weather Service Office web-sitehttp://www.weather.gov/organization.php
.

You can find me on Facebook under Beau Dodson Weather - hit LIKE at the top of the page and you can follow along - also please pass the link along to your friends.
.
Don't forget that our friends at the Paducah, Kentucky US National Weather Service Office now has a Facebook page, as well! Click here and then hit LIKE at the top of their page.
.
The McCracken County Office of Emergency Management now has a Facebook page? This is a great way to stay in touch with local officials during and before a natural disaster. Here is their page - hit LIKE at the top of the button.
.
You can also find me on Twitter under Beau Dodson.
---
Meteorologist Beau Dodson---
"We don't control the weather - we just predict it"
.
McCracken County Office of Emergency Management
--------------------

I send out emails 2-4 days in advance of widespread severe weather episodes. Basically this is a "heads up" email. If you would like to subscribe then click here.
.
---
This site is non-profit and brought to you as a public service! .

No comments:
Post a Comment